Out of memory issue

Hello everyone! This is my first post in this forum, and I’m thrilled to be part of the community. Before I get started, I want to give a huge kudos to the entire community, which I’ve been following closely since the Bolt.new fork. I think I must be among the first to watch every Eduards and Colin video! lol

Yesterday, I faced an issue after pulling either commit e064803 or fce8999. It’s a bit of a guess, but I can’t be certain which one caused the problem.

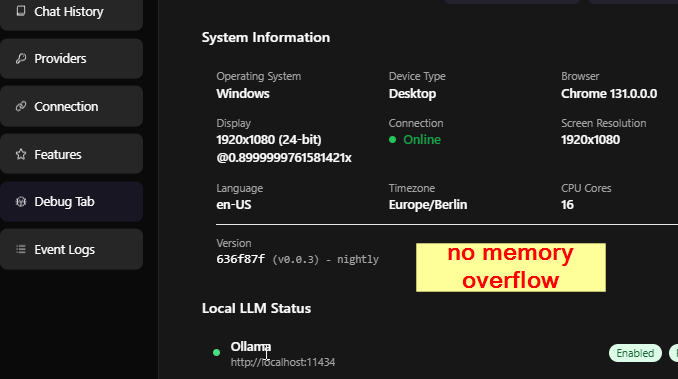
Here’s what happens: my browser crashes and I receive an Out of Memory error on my Canary browser

Here is my debug info:
{
“System”: {
“os”: “Windows”,
“browser”: “Chrome 133.0.0.0”,
“screen”: “2560x1080”,
“language”: “en-US”,
“timezone”: “America/Sao_Paulo”,
“memory”: “4 GB (Used: 198.03 MB)”,
“cores”: 8,
“deviceType”: “Desktop”,
“colorDepth”: “24-bit”,
“pixelRatio”: 0.800000011920929,
“online”: true,
“cookiesEnabled”: true,
“doNotTrack”: false
},
“Providers”: [
{
“name”: “Ollama”,
“enabled”: true,
“isLocal”: true,
“running”: false,
“error”: “No URL configured”,
“lastChecked”: “2024-12-19T15:12:34.640Z”,
“url”: null
},
{
“name”: “OpenAILike”,
“enabled”: true,
“isLocal”: true,
“running”: false,
“error”: “No URL configured”,
“lastChecked”: “2024-12-19T15:12:34.640Z”,
“url”: null
},
{
“name”: “LMStudio”,
“enabled”: true,
“isLocal”: true,
“running”: false,
“error”: “No URL configured”,
“lastChecked”: “2024-12-19T15:12:34.641Z”,
“url”: null
}
],
“Version”: {
“hash”: “381d490”,
“branch”: “main”
},
“Timestamp”: “2024-12-19T15:12:36.477Z”
}

I can’t say for sure if this is directly related, but it’s worth noting that code streaming seems glitchy and irregular—it just doesn’t “flow” as smoothly as before.

Moreover, I’ve noticed some warnings:
[WARNING]
12/19/2024, 12:40:35 PM
Resource usage threshold approaching
{
“memoryUsage”: “75%”,
“cpuLoad”: “60%”
}

Overall, the performance is noticeably slower, and after some time, my Chrome crashes and this is what I get on the console:

The initial issue occurred with Haiku 3.5, but it has also shown up with several other models, including Llama 3.3, Amazon Nova, Codestral, and GPT-4o.

Thank you for your time, and looking forward to your insights!

That’s super strange, I haven’t seen this before! Besides the code streaming being a bit more glitchy, I did notice that for a bit yesterday.

Firstly, Chrome Canary isn’t required anymore for bolt.diy, maybe you could try with another browser?

Secondly, @thecodacus and @dustinwloring1988 have been helping a TON merging in PRs recently (thanks guys!). Do you guys know if there are any that have been merged recently that could affect memory usage in the browser?

I had this issues also, I guest last week, but not anymore, but not just in bolt, also in some other tabs (e.g. UniFi UI, …). So I am not sure if is/was maybe a chrome problem (I use chrome and canary is also chrome).

Or bolt destroyed also my other tabs, than its bolt :smiley:

yeah added a PR to control the speed of code streaming and add a cap of 100ms as lowest chunk time, so that it wont go faster then that, should make it configurable in setting tab in future so that we can test the best value.
so it may look like its happening in chunk. as oppose to each character.

but this actually improves the performance as its not calling the the files api too frequently like before.

1 Like

@mmakoto are you importing any large project?
or doing a gitclone? browser has a limit on how much you can store on memory from a single origin. so all the chats and data cannot cross a certain size limit

because the I can see the crash is happening just before it pushes some data to the indexDB

No, that’s not the case. I’m starting from scratch; it’s a prompt describing a homepage and its sections and the screenshot of a page. I just tried again with ChatGPT 4o and it happened again after just 3 prompts:

I tried both with Chrome and Canary (which is also Chrome) and now with Edge. Got the same result and the browser crashed:

Memory used by the Bolt tab balloons to around 11Gb and then it crashes.

My prompt was: “Code this page” and the screenshot I provided - despite being large (in pixels) - is within what the model accepts (8k pixels in height). It was the same screenshot I have been using this week without problems.

Update: Reverting back to the stable branch and running v0.0.3 made it work again.

okay so maybe any of the new PR is causing this.
and if its working fine after reverting to 0.0.3, then there is not many PR added after that… will review all of them to see what causing this

i am glad that the stable is serving its purpose :wink:

2 Likes

can you show this tab in browser
strangely its not happening on macos
although i am not using images

weirdly not able to replicate with images as well

maybe @dustinwloring1988 can help and try on windows

1 Like

I also dont get it on windows.

Testcase:
image

we are checking the root cause of this. will update once figure out whats actually causing the memory leak.

1 Like

I recorded the incident here.

I cloned the latest version on Main and spun it. When trying to replicate the issue I tried Gemini 2.0 Flash first (as it wouldn’t cost me) but using the same prompt the memory leak did not occur. Tried again with some other model (don’t remember, maybe Sonnet) and nothing happened again. Then I went back to the models the issue happened with.

I recorded myself using Athene through OpenRouter and you can check out how the browser crashes.

Yes I have noticed it happening for me only on Groq 70-90b models.
. still not able to figure out what is causing this issue… Initially thought the streaming is causing the problem but its cuz I have disabled streaming and i m still getting the issue

I noticed that sometimes Bolt goes back and rewrites the same files over and over (at least that’s what I see streaming). Looks like some sort of loop while waiting and it seems especially bad when models are slow. When using Gemini, that barely had time to happen, the model was streaming so fast.

1 Like

try checking this PR,
it might fix your Issue. its fixing my browser crashes due to too fast streaming response.

1 Like

I think this fixed it, Anirban!

Quickly tested under exactly same conditions and it didn’t crash this time around.

2 Likes

wow… awesome!!! thanks for quick check

2 Likes

Guys sorry for resurrecting this issue :joy: but the issue has returned. I think Bolt is not dealing well with streaming response in some cases. It happened when I tested with the new DeepSeek V3 and Codestral.