![]() How do you debug OttoDev. I want to know how to step through it’s code.
How do you debug OttoDev. I want to know how to step through it’s code.
Sounds like a brilliant idea!
What do mean, you want to debug APP that is developed by oTToDev or do you want to debug oTToDev itself?
If second, run app with npm run build && npm run start
IT will propose to:
- press d to open dev tools, it will open debugger for server side
- Press b for opening in browser, there you can open your browser developer tools to inspect client side
1 Like
You are correct, the 2nd option, debug oTToDev itself?, but i want to be able to step through the code line by line to see the input, output, errors as they occur. I will check the “b” option and see what I can get from there.
Note I have been running “npm run dev” so i will try “build”/ “start”.
Great to see you here - love your videos on Bolt also . Thank you.
1 Like
Why do you want to debug? Want to learn how it works or other reasons?
Usually its good to know reasons to help better.
1 Like
I got it working this way…
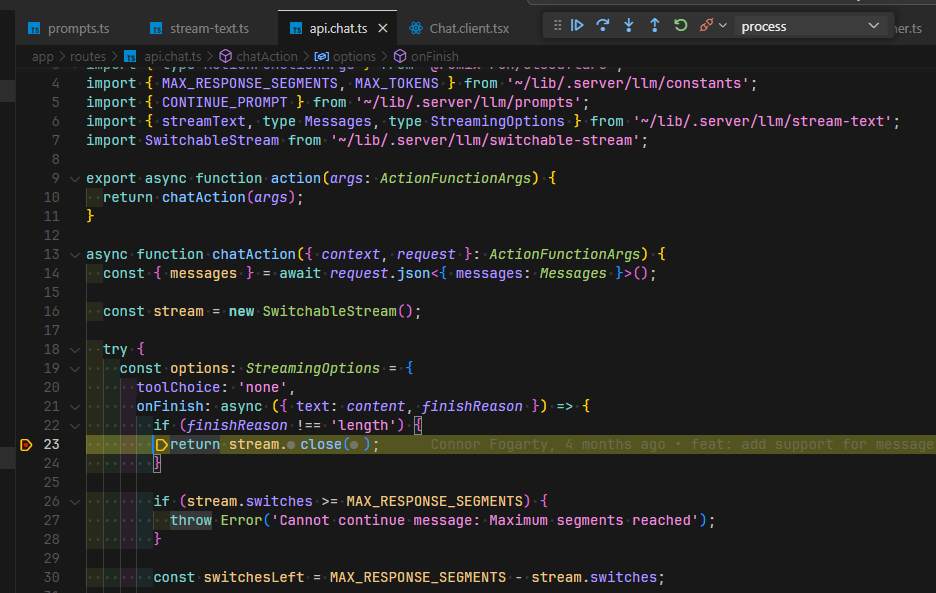
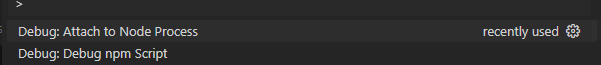
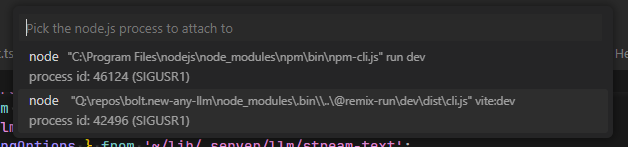
So what I did was to run the app normally using npm run dev then in vs code ctrl + shift+ P then choose debug attach to node process:
there may be more process but in my screenshot I chose the one highlighted below.
Now the debugger attaches and I have working breakpoints.
Yay! My first contribution!!
Happy Coding ![]()
4 Likes
That’s the stuff right there, debugging through IDE and attaching to the node process is your best bet.
Hi WonderWhy, yes, i am a web developer so i want to know how it’s working and what the hiccups are and being able to step through the code line by line 1) teaches me how it work using the visual and 2) i can pinpoint errors faster.
1 Like
Yes that is it. this will be how my weekend will be spent. thanks so much!
1 Like
It could be a good idea to make a video about how it works internally.
Could help contributors.